Program "Konwerting taśm samoprzylepnych i taśm OCA z wykorzystaniem środowiska Clean
Room" W ramach działania 3.2 "Innowacje w MŚP" w ramach Regionalnego Programu
Operacyjnego Województwa Śląskiego na lata 2014-2020.
Surface preparation before bonding — 7 mistakes that ruin even the best tape
“No adhesive will ever work well on dirt. Cleanliness is the first stage of every bond.”
Tomasz Gorzawski, CVGS
It is said that 80% of adhesive bond failures begin at the surface preparation stage. That is not marketing exaggeration — it is an observation from thousands of production implementations. The best tape or adhesive will not help if the surface is greasy, dusty or cold — or if the ambient conditions at the workstation, temperature and humidity, remain outside any control.
Why surface preparation matters most
A properly prepared surface delivers four measurable benefits: it lets you exploit the adhesive’s properties to the full, ensures stable and repeatable bonds in production, reduces the risk of debonding at later stages of the process, and cuts the number of complaints, rework and material losses.
LSE materials (PP, PE, POM, TPE) have low surface energy — the adhesive does not spread and adhesion is weak or non-existent. That is why they require activating treatment. But even HSE materials (metal, glass, PC, ABS) have minimum cleanliness requirements for the adhesive to reach its full properties.
Two categories of preparation methods
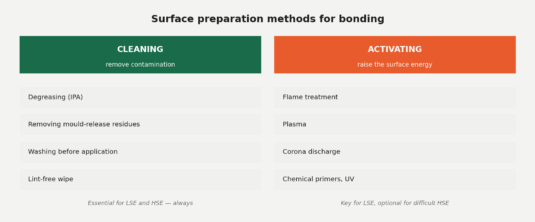
Fig. 1. Two categories of surface treatment in the context of bonding: cleaning — always, activation — for LSE and difficult HSE.
Cleaning methods
Their task is to remove the layer of dirt, grease, dust and contamination. Essential for both LSE and HSE. They include: degreasing with isopropanol (IPA) or dedicated cleaning agents, removing injection-mould release residues, washing parts before application, and wiping with a lint-free cloth.
Activating methods
Their goal is to increase polarity, surface energy and wettability. Crucial for LSE. They include: flame treatment, plasma, corona discharge, UV, ionising radiation, and chemical primers and adhesion promoters. We cover them in detail in the next article of the series (4/10).
7 mistakes that ruin the bond
1. Using the same wipe for many parts
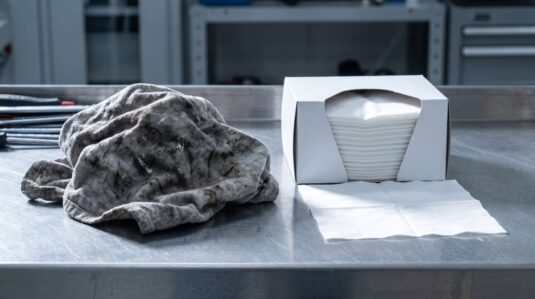
A classic. The operator degreases part after part with the same wipe, which of course delivers ever worse results — instead of removing contamination, it merely spreads it around. Gloves transferring grease onto the surface work exactly the same way. The result: a surface that looks clean but is coated with a thin film of redistributed contamination that effectively blocks adhesion.
SOLUTION
Replace wipes every few parts or use single-use wipes, lint-free materials dedicated to degreasing, fresh gloves. Replacement frequency written into the work instruction. In quality-critical applications — a clean workstation with access control.
Photo 1. On the left, a tool that spreads dirt; on the right — one that removes it. The difference costs pennies per part. (Illustrative image.)
2. Too little cleaning agent
“A few drops will do” — they will not. The cleaning agent must wet the whole surface, dissolve the greases and evaporate, leaving a clean, dry surface. Skimping on IPA leads to bonding on a partially contaminated surface, and the pennies saved on chemicals come back a hundredfold in complaints.
SOLUTION
Aerosols, chemical dispensers or ready-to-use pre-saturated wipes — the dose stops depending on the operator’s judgement.
3. Bonding at too low a temperature
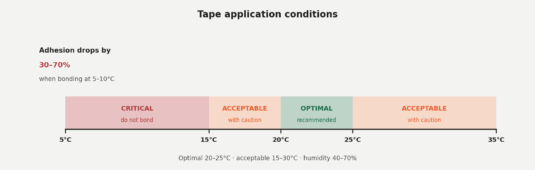
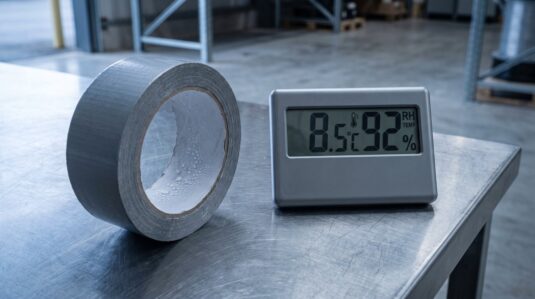
“Cold adhesive doesn’t stick” — that is no metaphor. Adhesives respond to temperature with their whole behaviour. Bonding below 15°C, or using tape taken straight from a 5–10°C warehouse, means the adhesive has low tack and does not wet the surface — it is hard and stiff, so it cannot fill the micro-roughness. Adhesion then drops by 30–70% (a range from CVGS observations and tests — not a constant for every adhesive and substrate), and bonds start failing on the first day of service.
This rule applies to all types of tapes and adhesives — not only PSA systems. What differs is the scale of the effect, not the mechanism itself.
Fig. 2. Tape application temperature ranges. Cold materials need several hours to acclimatise to workstation conditions before they are bonded.
SOLUTION
Monitor workstation conditions, store adhesive materials as the manufacturer recommends, and apply under controlled temperature and humidity: optimally 20–25°C, minimum 15°C, humidity 40–70%. Always verify the exact minimum for a given tape in its TDS.
Photo 2. A roll straight from a cold warehouse — condensation on the surface is a signal that application is still a long way off. Acclimatisation takes hours, not minutes. (Illustrative image.)
4. Too much time after removing the liner
PSA adhesives are by definition open to the environment. The moment you remove the protective liner, the adhesive surface starts ageing: the adhesive loses its initial tack and collects dust, particles and micro-contamination. Wettability decreases and the adhesive stops “flowing into” the surface. The result: an adhesion drop of up to 30–60% — the real scale depends on exposure time, dust levels, humidity and workstation temperature (range from CVGS data).
SOLUTION
Optimise the time from exposing the adhesive layer to application. Do not leave opened parts on the production line — this covers process breaks, shift changeovers and ordinary lunch breaks. Partial liner die-cuts that expose the adhesive only at the moment of application are a great help.
Photo 3. Adhesive exposed “in advance” collects dust and lint from the air — every minute of exposure is a real drop in adhesion. (Illustrative image.)
5. No pressure during application
PSA adhesives are activated by pressure. Laying the tape on gently, uneven pressure, no application roller — all of this means the adhesive does not fill the micro-roughness. In laboratory testing the minimum application pressure is 1.5–3 kg/cm². Without proper pressure we get falsely low adhesion results.
SOLUTION
A work instruction, pneumatic presses, pressure blocks, and in serial applications — application stations with parameterised force and dwell time. A heated pressure block additionally speeds up bond formation.
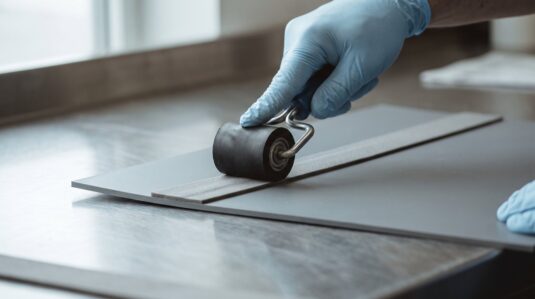
Photo 4. The application roller is the cheapest “activator” of a PSA adhesive — only under pressure does the adhesive flow into the substrate’s micro-profile. (Illustrative image.)
6. Disturbing the bond too early
PSA adhesives build strength over time. Right after application the bond has only 30–50% of its final strength. The adhesive reaches full properties only after 24–72 hours. Yet many teams test “whether it holds”, load the part, introduce vibration or move the part right after bonding. All of this destroys a bond that has not yet developed.
SOLUTION
Account for strength build-up in the process analysis and the flow of operations: no loads, vibration or transport immediately after application. Minimum 24 h of rest, 72 h for critical applications.
7. Stretching the material during application
This mistake often goes unnoticed, but it can be fatal. If the material is stretched during bonding, after application it “pulls back” and tears the tape off. Material stiffness works the same way — the part tries to return to its original shape, generating debonding forces. Particularly problematic is the shape memory of material from a roll: once unrolled, it still “wants” to be curved.
SOLUTION
Materials, carriers and adhesive layers of appropriate quality, application jigs that make stress-free application easy, and in serial production — automatic applicators.
RULE
If the material is stretched, the tape is fighting physics, not the surface. And it will always lose.
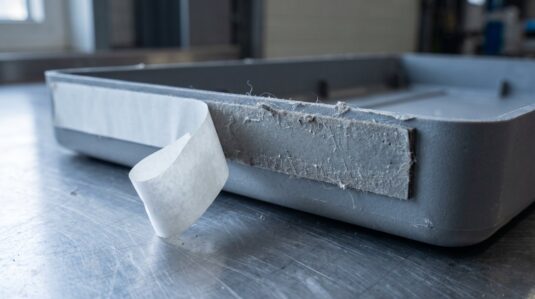
Photo 5. Shape memory in action: a bent part returns to its geometry and lifts the end of the tape. That is not an adhesive defect — it is stress in the material. (Illustrative image.)
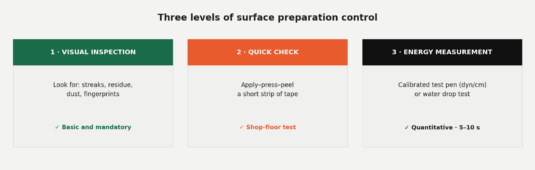
Verifying preparation quality — three levels
Fig. 3. Three levels of control: from simple visual inspection, through a quick tape test, to quantitative surface energy measurement.
Visual inspection
Basic and mandatory, yet the most frequently skipped. We look for streaks, residue, dust, fingerprints. The surface must be uniform, matte and dry. We verify that the operator did not “spread” the dirt instead of removing it. This simple check eliminates most errors.
Initial adhesion test (Quick Check)
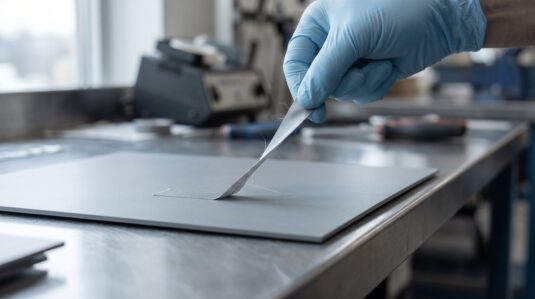
Apply a short strip of tape, press it down and peel it off. Assess whether it comes off too easily and whether it lifts contamination or a coating. A simple test any operator can run after minimal training.
Photo 6. Quick Check: apply, press, peel. Thirty seconds that catch a badly prepared surface before the customer does. (Illustrative image.)
Surface energy measurement
A test pen or ink test (e.g. 38 dyn/cm), or a water drop test with contact angle assessment. It shows whether the surface “wants” the adhesive. Done in 5–10 seconds, it delivers hard numerical information. We covered the measurement methods and tool selection in detail in article 1/10 on LSE and HSE.
The specification almost nobody closes — the product’s minimum surface energy
Purchase specifications and drawings very easily acquire a minimum tape adhesion. No wonder — the values are at hand, because manufacturers publish them in technical data sheets (TDS). Far more rarely does anyone write in the other half of the equation: the minimum surface energy of their own product.
And without it, the adhesion requirement hangs in a vacuum. TDS values are measured on standardised plates — most often polished stainless steel — not on your part made of modified PP or recyclate. We know the result from complaints: the tape supplier meets the specification, the process follows the instruction, and the bonds still fail, because the only uncontrolled variable was the product’s surface.
How to close the specification:
Write the minimum surface energy in the bonding area into the product drawing or specification — for most adhesives a practical threshold is ≥ 38 dyn/cm.
Define the measurement method (test ink or test pen) and the moment of control: incoming material batches and — where activation is used — the end of the window between activation and bonding.
For recycled materials and polymer blends — measure batch by batch, because batch-to-batch scatter can be larger than for virgin polymers.
In complaints: first measure the product’s surface energy, only then discuss the tape.
PRINCIPLE
Adhesion from the TDS describes the tape. Surface energy describes your product. The specification is closed only when it contains both values.
Photo 7. The measurement that closes the specification: the product’s surface energy measured in the bonding area and recorded in the documentation — next to the required tape adhesion. (Illustrative image.)
The most common organisational mistake: starting with the complicated approach
We often see it at customers: investment in plasma, corona, UV — before the basic problem has been solved. And the problem is most often missing degreasing, moisture, dust, the wrong wipe or low temperature.
PRINCIPLE
Basics first, special technologies later. Plasma, corona and primer are powerful tools — but they will not replace a fresh wipe, a clean glove and the right temperature at the workstation.
The second systemic problem is a lack of consistency. Every shift does it its own way, cleaning agents change, flash-off times differ. This leads to unrepeatable results and “random quality” — on Monday everything holds, on Wednesday half the batch goes to complaints.
The technologist’s checklist
Step
What to do
How to verify
Specification
Minimum surface energy of the product in the bonding area (e.g. ≥ 38 dyn/cm) written into the drawing or specification
Entry in the documentation + ink measurement at batch acceptance
Environment
20–25°C, humidity 40–70%, no condensation
Thermo-hygrometer at the workstation
Acclimatisation
Tape and materials at workstation temperature for at least several hours
Record of the delivery date from the warehouse
Cleaning
IPA or a dedicated agent, lint-free wipe, fresh
Process standard card
Flash-off
Wait until the agent has fully evaporated (typically 30–60 s)
Visual check — surface matte and dry
Inspection
Visual + optionally 38 dyn/cm test ink or pen
Recorded results per batch
Application
Immediately after liner removal, pressure 1.5–3 kg/cm²
Application roller with force control
Strength build-up
Minimum 24 h without load, 72 h for critical applications
Production plan accounts for the time
Tab. 1. Surface preparation checklist — from the specification, through environment and cleaning, to bond strength build-up.
Summary
Seven mistakes, one checklist and one value in the specification that is easiest to forget. Surface preparation is not something you do “every now and then, when there is a problem”. It is a routine built into the process, with a documented procedure, verified results and a closed specification — on the tape side (adhesion) and on the product side (surface energy). Such a standard is quick to implement and delivers the highest return of all investments in bonding.
“Basics first, special technologies later.”
Tomasz Gorzawski, CVGS
CONTACT THE CVGS LABORATORY
Want to simplify surface preparation in your production? Book a consultation with the CVGS laboratory — we will help you implement a standard matched to your materials and working conditions.
LSE vs HSE
“It’s not that the tape doesn’t stick well — it’s that the surface won’t let it stick.”
Tomasz Gorzawski, CVGS
If you’ve ever tried sticking double-sided tape to a polypropylene casing and found that after a few hours it came off at the slightest touch — you weren’t just unlucky. You were dealing with a material with low surface energy. Understanding what surface energy is and how it classifies materials into LSE and HSE is the first step towards ensuring that adhesive bonds are no longer a matter of chance.
Surface energy in a single diagram
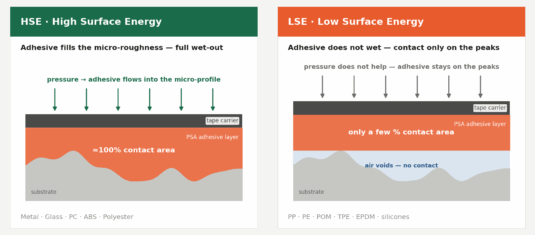
The quickest way to see the difference between LSE and HSE is to take a look at how the same tape behaves on both types of surface. The same adhesive. The same pressure. Different substrates. Different results.
The key factor is not the thickness of the adhesive layer, but rather how much of the substrate’s micro-profile the adhesive is able to fill. This is the whole difference between a bond that lasts for years and one that fails after a few hours.
Fig. 1. The same tape on an HSE and an LSE surface. On the HSE, the adhesive fills the micro-roughness and achieves almost full contact with the substrate. On the LSE, it rests on the peaks of the profile — air gaps remain between the adhesive and the substrate, and the actual contact area is only a few per cent of the nominal area.
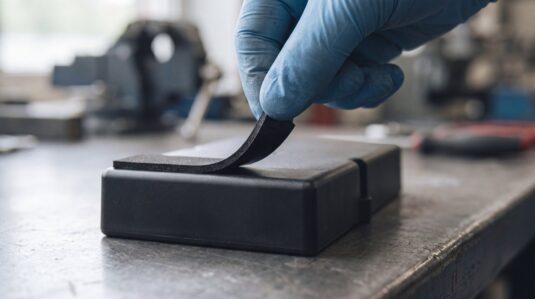
Fig. 1. This is how it looks in practice: the foam tape peels away from the PP casing almost without a trace — the adhesive never bonded to the substrate. (Illustrative photograph.)
CONDITIONS FOR GOOD BONDING
High surface energy of the substrate + good adhesive adhesion + adequate cohesion of the adhesive layer or carrier. If any one of these elements is missing, it is only a matter of time before the bond fails.
What are LSE and HSE?
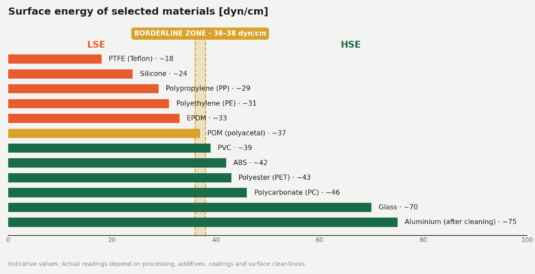
Materials are divided into two groups based on their surface energy. The dividing line is conventionally set at 36–38 dyn/cm — above this value, most PSA adhesives bond well without additional treatment; below it, activation or a special tape for LSE is required.
We treat this value as a practical guide rather than a physical constant. The result depends on the specific material, the coating used, cleanliness, surface treatment and surface condition — which is why we have marked a zone on the graph rather than a single line.
Fig. 2. A simplified scale of surface energy for typical manufacturing materials. The 36–38 dyn/cm range is a threshold area — below this, the material behaves like an LSE and requires activation or a special tape. The values are approximate; actual measurements depend on processing, additives and surface condition.
HSE — High Surface Energy
The adhesive wets the surface extremely well; adhesion is strong, and acrylic tapes (such as VHB) achieve full strength without additional activators. This group includes metals, glass, polycarbonate (PC), ABS, polyester, PVC, polyurethane, acrylics and Kapton.
LSE — Low Surface Energy
The adhesive does not spread; it forms droplets on the surface, and adhesion is poor or non-existent. Typical examples include: polypropylene (PP), polyethylene (PE — HDPE, LDPE), polyacetal (POM), thermoplastic elastomers (TPE, TPU), EPDM and modified PA6.
The most challenging materials are Teflon (PTFE) and silicones. To be more precise than simply calling them ‘non-bondable’: they are very difficult to bond using standard adhesive systems; however, with the use of dedicated primers, surface activation or special adhesives, a bond can be achieved.
Which materials are LSE and which are HSE — reference guide
Table 1 — Which materials are LSE and which are HSE: a cheat sheet
Material
Surface energy [dyn/cm]
Group
What it means in practice
PTFE (Teflon)
~18
LSE
Requires dedicated systems, primers or activation
Silicones
~24
LSE
Standard PSAs do not bond; silicone adhesives needed
Polypropylene (PP)
~29
LSE
LSE tape or activation (flame, plasma, corona)
Polyethylene (PE — HDPE, LDPE)
~31
LSE
As above; a frequent issue with housings and flaps
EPDM, TPE, TPU
~30–34
LSE
Plasticiser migration on top — check compatibility
POM (polyacetal)
~36–38
borderline
Behaves differently from batch to batch — always measure
Modified PA6
~36–42
borderline
Modifiers can push the material towards LSE
PVC
~39
HSE
Standard adhesives bond; watch out for plasticisers
ABS
~42
HSE
Good substrate for acrylic tapes
Polyester (PET), Kapton
~43
HSE
Stable, predictable bonds
Polycarbonate (PC), acrylics, PUR
~44–46
HSE
VHB reaches full strength without an activator
Glass
~70
HSE
Very good substrate after degreasing
Metals (steel, aluminium)
≥75 after cleaning
HSE
Surface condition decides: oil, oxides, coatings
Tab. 1. Indicative surface energy values and their consequences for tape selection. Materials in the borderline zone should always be measured before a solution is chosen.
Problem category — recycled materials and porous surfaces
Even if the base material is HSE, the presence of additives, stabilisers, mould release agents or a light coating of oil can drastically reduce the effective surface energy. The same applies to recycled surfaces — they may behave like LSE, even if they are chemically HSE.
In recycled materials and polymer blends, the variation in results is often significantly greater than for virgin materials. This means that a single measurement on a single batch is not sufficient to settle the matter.
FROM CVGS’S EXPERIENCE
We encountered a case where a tape with stable, repeatedly verified parameters ceased to function after the customer switched to recycled material. The cause was not the tape itself, but the unstable and reduced surface energy of the new substrate.
Fig. 2. Three batches of the same recycled component — differences in shade and texture are visible to the naked eye, and the surface energy varies accordingly. (Illustrative photograph.)
How to measure surface energy in practice — a marker or ink?
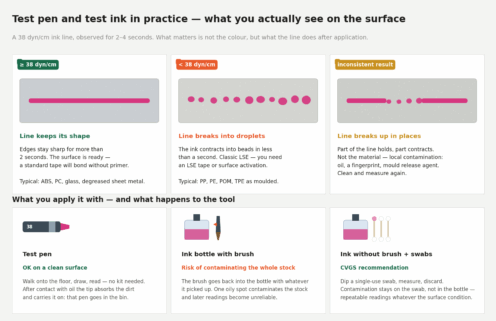
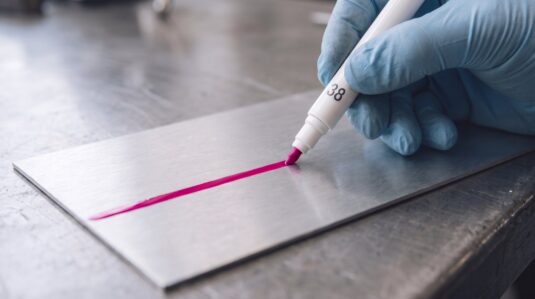
Before you choose a tape, it’s worth knowing exactly what you’re working with. Two tools calibrated to a specific value in dyn/cm (usually 38) are used for this: a test marker and test ink. The reading principle is the same in both cases — you draw a line several centimetres long and observe it for 2–4 seconds (the observation period depends on the type of ink). A line that remains straight indicates that the surface has at least the tested energy level. A line that converges into dots or ‘shrinks’ indicates a lower energy level.
The difference between the marker and the ink therefore does not lie in the physics of the measurement, but in what happens to the tool after it comes into contact with a dirty surface.
How to interpret the result — three scenarios you’ll see on site
In practice, the line behaves in one of three ways, each leading to a different decision:
The line retains its shape for over 2 seconds — the surface has at least the tested energy level. You can bond using a standard solution.
The line breaks up into dots in less than a second — a classic LSE. You’ll need LSE-grade tape or surface activation.
The line breaks in places — part of the line holds, part shrinks. This is usually not down to the material, but localised contamination: oil, a fingerprint, or a release agent from the mould. Clean, degrease and measure again.
Fig. 3. Three typical readings for a 38 dyn/cm line and three ways of drawing it. The marker and the ink measure the same value, but they cope differently with contact with a dirty surface — and it is this difference, rather than accuracy, that determines the choice of tool.
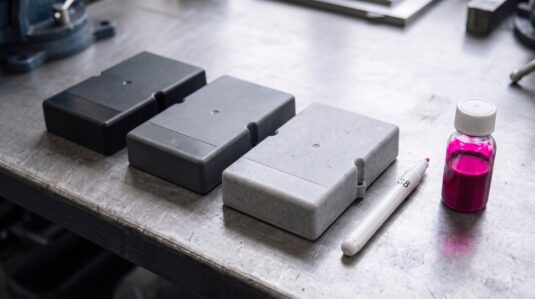
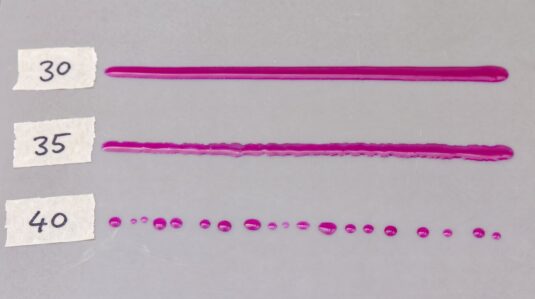
Fig. 3. Bracketing on a PP panel: ink 30 wets the surface and holds the line; 35 begins to break up at the edges; 40 shrinks into droplets — the surface energy of the material is approx. 30–35 dyn/cm. (Illustrative photograph.)
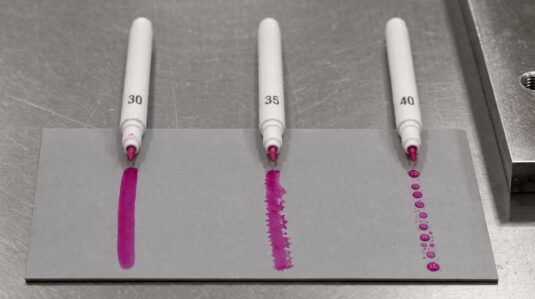
Fig. 4. The same measurement using 30/35/40 test pens — three marks, three behaviours, one answer. (Illustrative photograph.)
Five scenarios from the production floor
Theory ends the moment you stand at the machine. Below are the scenarios that occur most frequently in surface energy testing — and the conclusions that can be drawn from them.
A PP housing straight from the injection moulding machine. The line breaks up immediately. No surprise there – PP is LSE by definition. The decision is made straight away: LSE tape or activation.
Aluminium sheet after stamping. The marker reads ‘below 38’, even though aluminium is a textbook HSE material. You’re not measuring the metal — you’re measuring the thin layer of process oil left on it. After wiping with IPA, the mark holds. This is the most common cause of ‘strange’ results on metals.
Polycarbonate with protective film. The line holds beautifully – except that it’s on the film, not on the material itself. The test is always carried out on the surface that will actually come into contact with the tape, not on whatever happens to be on top.
PP after flame activation. Immediately after activation, the 38-line mark holds. After two days, the effect is already noticeably weaker — the activation wears off over time. It is therefore necessary to measure not only immediately after activation, but also at the end of the actual window between activation and bonding.
A detail from recycled material, another batch of raw material. The previous batch passed the test without any issues; the same line on the new batch breaks up into dots. With recycled materials, measurements are taken batch by batch, rather than just once per production run.
Fig. 5. Flame activation of a PP profile on the production line — increases the surface energy of polyolefins from approx. 30 to over 45 dyn/cm, but the effect diminishes over time. (Illustrative image.)
Test marker — quick verification at the customer’s premises
The marker is unrivalled where time is of the essence: you walk into the workshop, draw a line, and you have your answer. It requires nothing but itself. However, it has one condition for use and one pitfall.
Clean surface — reliable result. The marker works perfectly on substrates prepared for bonding: after washing, degreasing and activation.
A dirty or oily surface — throw the marker away. The tip absorbs dirt from the surface and carries it over to subsequent measurements. The effect is insidious: once the marker comes into contact with oil, it starts to ‘underestimate’ the results even on sound materials, so the technician rejects batches where nothing was actually wrong.
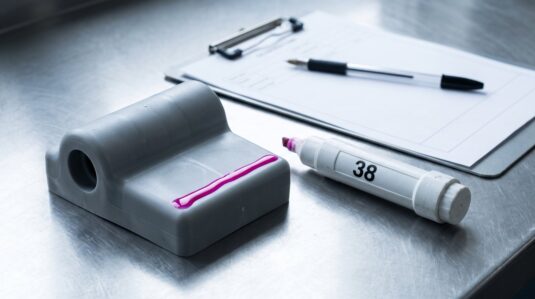
Fig. 6. A 38 dyn/cm marker on degreased aluminium — the line retains its shape, and the surface is ready for bonding. (Illustrative photograph.)
Fig. 7. The same value on polypropylene — the line shrinks into droplets in 2–4 seconds. A classic LSE reading. (Illustrative photograph.)
LSE. (Illustrative photograph.)
Test ink — repeatable measurement in the production process
Ink in a container with a brush has a design flaw that only becomes apparent in the actual production process: the brush returns to the container along with whatever it has picked up from the surface. A single oily substrate is enough to contaminate the entire stock.
CASE STUDY
The client was using ink in a container with a brush to inspect surfaces prior to the bonding process. The measurement showed a decrease in surface energy, and analysis indicated partial oil contamination of the material. The problem was that oil had also entered the ink container — from that point onwards, the entire measurement system was contaminated, and subsequent readings were no longer reliable.
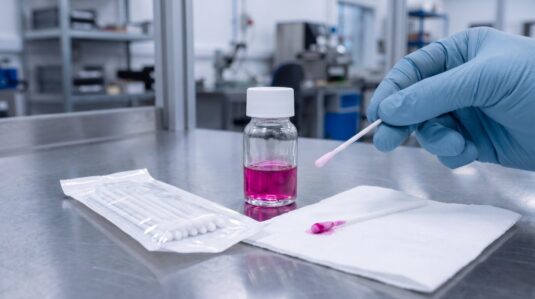
CVGS recommendation: ink without a brush + disposable application swabs. After each contaminated measurement, you discard the swab, not the entire set.
Fig. 8. The brush returns to the bottle with what it has picked up from the surface — a rainbow-coloured oily film is already visible on the surface of the ink. From this point onwards, the entire supply is contaminated. (Illustrative photograph.)
Fig. 9. Recommended kit: 10 ml ink without a brush and disposable swabs — a new swab for each measurement. (Illustrative image.)
When to use a marker, and when to use ink
Table 2 — When to use a test pen and when to use test ink
Situation
Recommended method
Why
Quick check at the customer’s site, clean surface
Test pen
Result in 2–4 seconds, no kit, nothing to spill
Check after washing or degreasing
Test pen or ink with brush
A prepared substrate does not contaminate the tool
Surface of unknown condition, suspected oil contamination
Ink without brush + single-use swabs
Contamination stays on the swab, not in the ink stock
Batch-to-batch scatter is larger than for virgin polymers
Tab. 2. Choosing a surface energy inspection method depending on the production situation.
Why this matters in production
The difference between LSE and HSE is not merely academic. In practice, it works as follows:
A polycarbonate (HSE) component bonded with VHB tape achieves full strength and does not delaminate even under dynamic loads. The same tape on a polypropylene housing will delaminate ‘with a fingernail’ after a few hours if the surface has not been prepared beforehand.
That is why the first question to ask when designing an adhesive bond is: what material am I working with — LSE or HSE? The answer determines everything: the choice of tape, the need for surface preparation, and the need to use a primer or activation (flame, plasma, corona).
Tapes designed for LSE — how they work
Since LSE surfaces ‘do not like’ adhesive, tape manufacturers have developed solutions capable of winning them over. Tapes for LSE have several features that distinguish them from standard ones:
High wet-out — adhesives with a very high ability to wet the surface.
Greater adhesive elasticity — allowing micro-roughness to be filled in.
Modified rubber or special LSE acrylics — as the chemical base.
Higher tack — the adhesive ‘grips’ the difficult surface immediately.
The ability to eliminate the need for a primer — in many applications, it is no longer necessary to use an activator.
Typical applications for LSE tapes
Assembly of PP and PE components (housings, flaps, handles). Bonding of foams to PP/PE. Labelling of LSE surfaces. Assembly of decorative elements onto plastics. Bonding of EPDM and TPE seals. Applications in the automotive and household appliances sectors. Logistics labels on LSE surfaces.
The water drop test — when you don’t have a marker or ink to hand
In production environments, it is not always clear what the actual surface energy of a material is — particularly after processes such as injection moulding, painting or embossing. We have discussed markers and ink above; if you do not have either to hand, there is a method that requires nothing more than water.
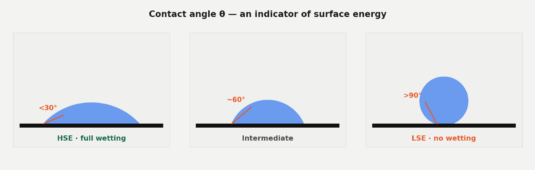
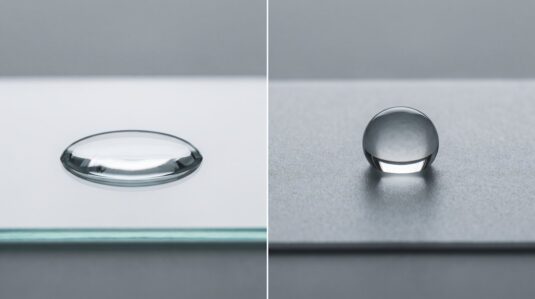
The contact angle is assessed. A drop that spreads out flat (small contact angle) indicates high surface energy. A drop that retains a hemispherical or ‘spherical’ shape (large contact angle) indicates low surface energy. The test does not provide a numerical value, but within a few seconds it shows the general trend and allows you to decide whether it is even worth using standard tape.
Fig. 4. Contact angle of a water droplet: below 30° — an HSE surface; above 90° — an LSE surface requiring activation.
Fig. 10. The same drop of water on glass (HSE) and on polypropylene (LSE) — the difference is visible without any equipment. (Illustrative photograph.)
PRACTICAL TIP
All three tests — the marker, ink and water droplet tests — take 2–3 seconds and require no specialist laboratory equipment. These are the bare essentials that should form part of every bonding technician’s toolkit.
Summary
Surface energy is a key parameter that determines whether bonding will be successful — regardless of how good the tape we buy is. HSE materials (metals, PC, ABS, glass) adhere well to adhesive. LSE materials (PP, PE, POM, TPE, EPDM) require either special tapes or surface activation. Distinguishing between these two groups, measuring the actual condition of the surface — rather than guessing — and making an informed choice of solution are the foundations of any durable adhesive bond.
“The quality of the bond is determined before you apply the adhesive — on the surface.”
Tomasz Gorzawski, CVGS
Previously, we showed you the difference between cohesion and adhesion; today, we’ll look at how LSE and HSE materials differ. In the next articles in this series, we’ll show you how to effectively prepare a surface for bonding, how to choose the right type of adhesive (acrylic vs rubber vs silicone), and how to measure bond quality using the Peel, Loop Tack and Rolling Ball methods.
Adhesion vs. cohesion — anatomy of the bond
“Tape doesn’t bond on its own — it bonds an entire system. A good system can replace screws and welds.”
Tomasz Gorzawski, CVGS
An adhesive bond has no single “holding force”. It has layers, interfaces, internal stresses and at least three different mechanisms by which it can let go. Understanding what adhesion is, what cohesion is, and what the failure of each one looks like on its own — that is the condition for designing durable bonds deliberately instead of firefighting them.
Anatomy of an adhesive bond
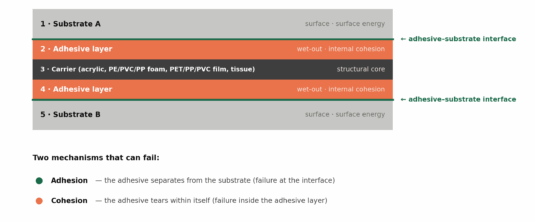
Every bond made with adhesive tape is in fact a five-layer stack: substrate A, adhesive, carrier (in double-sided tapes — a core between two adhesive layers), adhesive again, and substrate B. Transfer tapes have no carrier — there is only a single adhesive layer between the substrates. Whichever variant is used, the durability of the whole depends on how every layer and every interface behaves.
Fig. 1. Every double-sided tape bond is a five-layer stack with two critical interfaces. Failure can occur at an interface (adhesive failure) or inside the adhesive layer (cohesive failure).
Adhesion
Adhesion is the force holding the adhesive attached to a surface. Its value depends on several things: the surface energy of the substrate, the ability of the adhesive to wet the surface (wet-out), and how clean that surface is.
Adhesion is measurable — the typical methods are the 90° and 180° peel tests, which we will cover in a separate article in this series. Adhesion does not arise solely at the moment of application. With pressure-sensitive adhesives it can build over time as wet-out progresses. Its final level is therefore determined both by the application conditions and by the time the bond is given to develop.
Whether it ends up strong or weak is decided by correct application.
Wet-out — why it matters so much
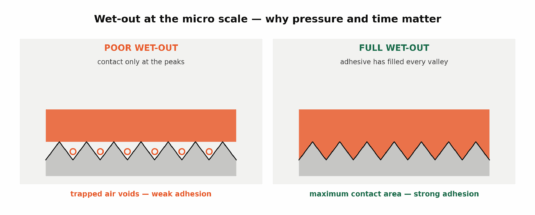
Wet-out is the ability of the adhesive to flow out across a surface and penetrate its micro-roughness. Without wet-out, the adhesive touches the substrate only at the peaks of the roughness — the effective contact area is a fraction of the nominal one. With wet-out, the adhesive fills the valleys between those peaks and substantially increases the real contact area between adhesive and substrate. The term describes the behaviour of the adhesive, so it applies to liquid adhesives and to pressure-sensitive adhesives in tapes alike — with the difference that the adhesive in a tape needs pressure and time to flow into the micro-roughness of the substrate.
Fig. 2. Wet-out at the microscopic level. Without wet-out, contact occurs only at the peaks of the roughness — air pockets remain between them and act as defects that weaken the bond.
What influences wet-out? Above all: contact time, application pressure, and the rheological properties of the adhesive at the application temperature.
Cohesion — the internal integrity of the material
Cohesion describes the ability of a material to hold together internally under load. In adhesive bonds we usually apply it to the adhesive layer, but in tapes with a carrier — a foam carrier, for instance — failure can just as well occur inside the carrier itself.
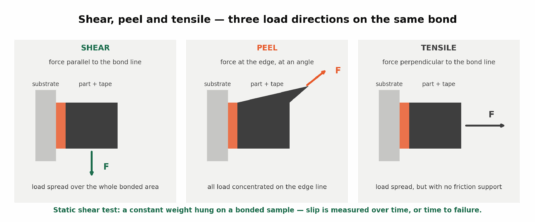
In industrial practice, cohesion determines how the adhesive behaves under sustained load (shear). A tape with high adhesion but low cohesion “floats” — it sticks firmly, but under constant load it starts to creep until the bond fails.
If material remains on both sides after separation, it is worth no longer asking only whether the adhesive held well. The weakest link may well have been the internal integrity of the adhesive itself, or of the carrier.
Fig. 3. Shear is a load acting parallel to the bond line — unlike peel, where the force concentrates at the edge. In a static shear test the sample is loaded with a constant weight and slip is measured over time.
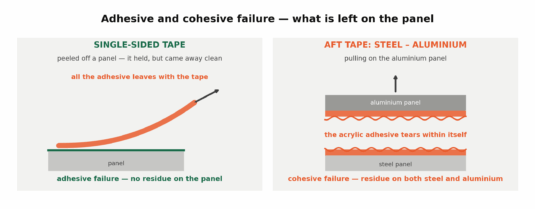
The difference between the two parameters is easiest to see after separation. A single-sided tape peeled off a panel comes away in one piece and leaves no trace — that is adhesive failure: something held, but it could be released. An AFT tape bonding a steel panel to an aluminium one behaves differently: pull on the aluminium and the acrylic adhesive tears within itself, leaving residue on both panels — that is cohesive failure.
Fig. 4. Adhesive failure (the adhesive separates from the substrate) and cohesive failure (the adhesive tears within its own layer).
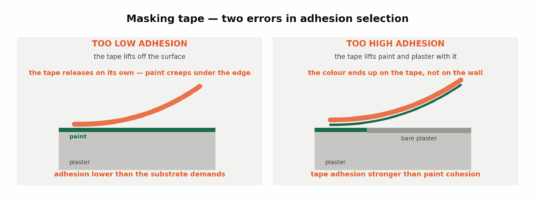
Adhesion is therefore not a parameter where higher is always better — it has to be matched to the application. A masking tape with too little adhesion lifts off the wall and paint creeps under the edge. One with too much comes away together with the paint, and sometimes with the plaster too: the adhesion of the tape turns out to be stronger than the cohesion of the paint film, and the colour ends up on the tape rather than on the wall.
Fig. 5. Two errors in selecting the adhesion of a single-sided tape: too low (the tape releases on its own) and too high (the tape lifts paint and plaster).
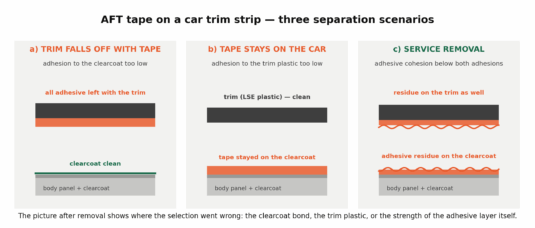
The second example is car trim strips bonded with AFT tape. When the trim falls off during driving together with the tape, the adhesion to the clearcoat was wrong. When the tape stays on the vehicle and the trim has fallen off, the adhesion to the plastic the trim is made of was not matched correctly. When, during service removal, the tape remains on the clearcoat and on the trim at the same time, it is the cohesion of the material that came into play: it is lower than the adhesion to either outer layer.
Fig. 6. Three separation scenarios for a trim strip bonded with AFT tape — the picture after removal shows which parameter was the weakest link.
This is why the choice of tape and the method of application are one decision, not two. Surface cleanliness and degreasing, a temperature inside the window recommended by the manufacturer, pressure, and time for wet-out determine whether the adhesion and cohesion we read in the technical data sheet ever materialise in the finished bond.
Mocowanie klamek i uchwytów – pewny chwyt bez widocznych łączników
A door handle is a component that the user touches a dozen or so times a day and which is subjected to cyclic loads throughout the vehicle’s lifetime. The mounting must not only be strong, but also resistant to fatigue, minor impacts and jolts. Traditional screws require holes, which weaken the component and are often visible, as well as providing a pathway for moisture.
3M VHB tape allows the door handle to be secured without affecting visible surfaces. The bond forms upon pressure, evenly distributes pull-out and shear forces, and accommodates minor irregularities in the part’s geometry. For the end user, the result is aesthetically pleasing – no screws, no gaps, a smooth surface.
The key to success lies in selecting the right adhesive for the specific material. Door handles are often made of metal, powder-coated or moulded from plastics with varying surface energies. A universal acrylic adhesive adheres perfectly to materials with high and medium surface energy (metals, glass, many plastics), whilst for low-energy surfaces, such as certain plastics and powder coatings, a modified adhesive or one from the VHB LSE range will perform better.
As the relative adhesion comparison shows, product families such as 4941 or 5952 offer high adhesion to HSE and MSE surfaces, whilst VHB LSE maintains high adhesion even to LSE materials. It is precisely this difference that determines whether a bond will remain reliable for years or start to fail after the first few seasons of use.
CVGS supports the customer during the material selection and surface preparation stages. We test wettability and adhesion on the customer’s actual substrates; where necessary, we recommend a primer to enhance adhesion, and then we cut tape blanks precisely tailored to the door handle’s bonding area. This enables the production line operator to apply the component in a single movement, without having to improvise.
The result is a fastening solution that combines mechanical strength with aesthetics and repeatability. This is a good example of how a seemingly simple detail gains in quality when, instead of a standard screw, we use a carefully selected and correctly converted 3M VHB tape.
The reliability of such a bond is confirmed by testing. 3M subjects the tapes to drop, tensile, shear and long-term ageing tests, examining the behaviour of the bond under real-world loads. For a component touched thousands of times during its service life, it is fatigue resistance – not momentary strength – that determines success.
From a production perspective, repeatability is key. CVGS supplies pre-cut pieces with consistent geometry and in a form that facilitates quick application, meaning the operator does not need to measure out or cut the material on the production line. The standardisation of the bonding area and clamping pressure directly translates into consistent quality for every door handle fitted.
As a result, a seemingly trivial component achieves a level of quality on a par with automotive standards: a secure grip, clean aesthetics and consistency from the first to the last unit in the series.
3M VHB Tapes in the Automotive Industry—The End of the Era of Screws, Rivets, and Welds
For years, the automotive industry has been searching for joining methods that are lighter, faster, and more durable than traditional mechanical fasteners. Every screw, rivet, or weld spot adds weight, increases the risk of corrosion, and creates a stress concentration point where fatigue damage can occur over time. 3M VHB tapes address these challenges by providing a structural bond that distributes loads evenly along the entire joint.
The secret lies in the viscoelastic core made of closed-cell acrylic foam. Instead of transferring forces at a single point, the tape absorbs dynamic and static stresses, distributing them across the entire bonded surface. As a result, the bond remains flexible, compensates for differences in the thermal expansion of the bonded materials, and dampens vibrations, which are one of the main fatigue factors in a vehicle.
From a designer’s perspective, predictability is key. 3M VHB tape reaches approximately 50% of its target strength just 20 minutes after being pressed into place, 90% after 24 hours, and 100% after 72 hours. The process can be accelerated by increasing the application temperature—at 65°C or higher, the bond very quickly approaches its maximum strength. This is crucial for assembly plants operating under strict production schedules.
Environmental resistance is equally important. The bond is resistant to UV radiation, moisture, thermal cycling, and solvents, while also sealing the joint against external factors. In practice, this means less galvanic corrosion, no leaks, and an aesthetically pleasing, invisible joint without protruding screw heads or weld marks.
CVGS’s role is to translate this potential into a ready-to-use, repeatable manufacturing solution. As a converter of self-adhesive tapes, we select the appropriate 3M VHB product family for the substrates and loads of a given assembly, die-cut it into shapes tailored to the part, and deliver it ready for assembly. The customer gains not only the material but also a proven process—from samples, through validation, all the way to PPAP documentation.
The transition from mechanical fasteners to 3M VHB tape is a design decision that pays off on many levels: lower weight, faster assembly, better aesthetics, and greater durability. In upcoming articles, we’ll show how this technology performs in specific automotive applications—from mounting door handles to soundproofing wheel wells.
The tape’s advantages are also evident in the numbers. Eliminating screws and rivets reduces vehicle weight, while the absence of drilling and welding shortens the assembly cycle and reduces the number of components in inventory. Lower weight, in turn, translates to lower fuel consumption or greater range in electric vehicles—which is why structural bonding fits so well with current trends in lightweight construction.
Material flexibility is also significant. The tape allows different materials to be joined without the risk of galvanic corrosion, which paves the way for mixed metal–plastic–glass structures. This is one of the main reasons why manufacturers are increasingly replacing traditional joining methods with solutions based on 3M VHB tape.
Training “Introduction to adhesive joints” – practical knowledge and exchange of experiences (23/04/2026)
On April 23rd, we had the pleasure of hosting our partners’ quality and engineering departments during a training session on adhesive bonding at the CVGS facility in Tychy. It was an excellent meeting full of practical knowledge, industry discussions, and collaborative solutions to technological challenges.
During the training, participants explored the topic of adhesive bonding comprehensively – from the basics of technology, through criteria for selecting an adhesive layer, to issues related to substrate surface energy and material testing methods. The practical portion of the training allowed them to see firsthand how different solutions perform under real-world production conditions.
Our goal is not only to impart theoretical knowledge but, above all, to demonstrate a practical approach to adhesive bonding technology – how to properly select materials, how to avoid errors in the process, and how to effectively resolve technical issues arising in production.
If your company is facing technical, quality, or engineering challenges related to adhesive materials and adhesive bonding, we are happy to help. We organize both group training sessions for entire teams and dedicated individual meetings tailored to the specific needs of your processes. Our engineers are also available directly at the production plant.
The 10 most important things you need to know before buying cork spacers for protecting glass during transport and storage
The transport and storage of glass are processes in which even minor oversights can lead to costly losses. Glass is a demanding material – it does not tolerate micro-movements, uneven pressure or poorly chosen protective materials.
One of the key elements of protection is glass spacers, and in particular cork spacers, which combine mechanical properties with the natural origin of the material.
Below, we present 10 key points worth knowing before choosing them.
How do glass spacers work?
Understanding how spacers work is the starting point for selecting them correctly. Without this knowledge, it is easy to make the mistake of choosing a solution that theoretically protects the glass but, in practice, does not eliminate the main causes of damage.
Spacers separate the glass panes, ensuring:
a constant distance between the surfaces,
reduced glass-to-glass friction,
even distribution of pressure,
absorption/damping of the pressure acting on the glass,
stabilisation of the glass during transport.
Their primary function is to cushion impacts and eliminate micro-movements, which are the main cause of localised stresses and micro-cracks.
Why are spacers crucial in the transport and storage of glass?
Much glass damage cannot be linked to a single specific incident. It occurs gradually – whilst driving, stationary, during storage or handling. Therefore, glass protection must be continuous, not just temporary.
Spacers stabilise the glass package both during transport and in storage, reducing:
scratches and cracks,
breakage,
complaints and material losses.
What can spacers be made of?
The material of the spacer directly affects the effectiveness of glass protection. Different solutions work well in different conditions, so it is worth knowing the available options and their limitations.
The following are used on the market, amongst others:
natural cork,
PE, EVA, PUR and PVC foams,
felt,
hybrid materials.
In this article, we focus on cork spacers, as cork has excellent recovery properties, is resistant to ageing, does not cool water, and is derived from a natural, renewable raw material. Additionally, cork does not react chemically with glass and is resistant to pressure,
4. Spacer – two functions in one product
The effectiveness of a spacer is not determined solely by the material itself. The key lies in combining mechanical properties with adequate stabilisation of the spacer’s position on the glass pane.
An effective spacer consists of:
a load-bearing layer (e.g. cork, foam) – responsible for load transfer and glass protection,
an adhesive layer – prevents the spacer from shifting.
Maintaining a balance between these layers has a direct impact on the safety of the glass.
What types of adhesion are there and how should they be selected?
The choice of adhesion is one of the most frequently underestimated aspects of glass protection. Too little adhesion causes spacers to shift; too much makes work difficult and can lead to problems during unpacking.
The following are used in spacers:
self-adhesive foam – the most commonly used solution,
low-tack – for lighter glass units,
high-tack – the strongest type of adhesion – not recommended for application directly onto the glass
The choice of adhesion should be tailored to the type of surface being protected. It is important to consider whether the glass has a coating, what its weight is, and under what weather conditions it will be transported. This particularly concerns temperature and humidity.
What forms do spacers come in?
The form of the spacer is important not only for protecting the glass, but also for work ergonomics and the repeatability of the packaging process.
Spacers are available as:
loose,
sheets,
rolls,
bobbins (automatic application)
pizza rolls (automatic application).
What should you look out for when selecting spacers?
When selecting spacers, the following key parameters should be taken into account:
the type and weight of the glass,
storage duration,
transport conditions,
temperature and humidity,
the number of warehouse operations.
The use of solutions such as cork or foam spacers is, in a sense, a standardisation of the packaging system. A suitably selected product effectively eliminates common transport problems.
Environmental considerations
The choice of spacers for protecting glass during transport is increasingly determined not only by technical parameters, but also by environmental impact and compliance with EU regulations. In this context, the difference between cork and foam spacers is clearly evident.
Cork spacers are made from a 100% natural, renewable and biodegradable raw material. Cork is harvested from the bark of the cork oak, without the need to fell trees, and the trees themselves store CO₂ as they grow, resulting in a very low carbon footprint for the material. Importantly, cork does not generate microplastics, and the adhesives used (PUR / LT / HT) account for only a small percentage of the total weight. As a result, cork spacers are currently considered the most environmentally friendly solution available in the glass transport industry.
Equally important is the ability to recycle and reuse. Cork spacers can be shredded and reprocessed, and in practice are often reused multiple times by different customers, with minimal degradation in quality. The product’s long lifespan means less waste and tangible environmental benefits.
Storage of spacers and shelf life
Even the best-suited spacer can lose its properties if stored incorrectly. This applies particularly to the adhesive layer.
Spacers should be:
stored in a dry and clean place,
protected from extreme temperatures,
used within the recommended shelf life.
Proper storage ensures the product retains its full functionality. Key information is provided in the product data sheets.
How to apply spacers and what are the most common mistakes?
Last but not least, the method of applying spacers is a crucial element of glass protection. Even the best product will fail to fulfil its purpose if used incorrectly.
Correct application requires:
a clean glass surface,
adequate pressure,
proper placement of spacers.
The most common mistakes are:
too few spacers,
incorrectly selected adhesion,
inappropriate format or thickness,
failure to take transport and storage conditions into account.
Spacers as part of a quality strategy
Spacers are not merely a packaging component, but a quality control tool in the transport and storage of glass. Their careful selection translates into reduced losses, more stable processes and greater confidence among end customers.
A conscious choice of spacers is not a cost, but an investment in process stability, glass safety and the trust of end customers.
10 key aspects of selecting sound-absorbing materials in automotive projects
The selection of sound-absorbing materials in projects for the automotive sector is an engineering process that directly impacts the fulfilment of NVH requirements, vehicle weight, component durability, and compliance with quality and regulatory standards. In such projects, a material cannot be assessed solely on the basis of its declared acoustic properties – its behaviour in the application, processability, and full compliance with OEM requirements are of key importance.
Below are 10 key areas to consider when selecting soundproofing materials for automotive projects.
1. Identification of the noise source and transmission mechanism
In automotive projects, the process of selecting acoustic insulation materials always begins with correctly identifying the noise source and its transmission mechanism. This is a critical stage, as even a material with very good laboratory parameters will not deliver the expected results if it is applied to the wrong NVH problem.
In automotive practice, three main noise mechanisms are distinguished:
Airborne noise – generated, amongst other things, by tyres, airflow or external components, penetrating into the vehicle interior through gaps, panels and trim elements. In such cases, absorbent and insulating materials operating in the mid-to-high frequency ranges are key, e.g. fibrous materials such as Thinsulate.
Structural noise – arising from the vibration of structural components (e.g. sheet metal, frames, mountings) which radiate sound into the vehicle interior. In this case, absorption alone is insufficient, and an effective solution often requires vibration damping (CLD) or appropriate separation of components.
Aerodynamic noise – associated with airflow around the vehicle, particularly significant at higher speeds and in modern vehicles with low-noise powertrains. In such applications, acoustic insulation materials must be selected for specific frequency bands that are most noticeable to the user.
The path of noise transmission is also of key importance – the same material may be effective in one place and completely ineffective in another if the method of installation, clamping, sealing and interaction with adjacent components are not taken into account.
Incorrect identification of the NVH mechanism often leads to:
the use of absorbers where vibration damping is required,
oversizing of materials ‘to be on the safe side’,
an increase in the weight and cost of the component without improving its performance,
the risk of failing to meet OEM requirements at the validation stage.
Therefore, in OEM, Tier 1 and Tier 2 projects, an analysis of the noise source and its transmission mechanism should always precede the selection of a specific material, regardless of whether it is a Thinsulate-type solution or an alternative.
2. Frequency range of the material
In applications, sound-absorbing materials must be selected for the specific frequency bands present in the given application, rather than on the basis of averaged acoustic declarations.
Thinsulate-type materials
Thinsulate-type materials, developed by 3M, among others, belong to the group of lightweight fibrous absorbers, which are highly effective in the mid and high frequency ranges.
In practice:
the best performance is in the range of approx. 500–2000 Hz,
with higher weight variants, the material also maintains good absorption in the lower part of the mid-frequency range,
efficiency at low frequencies (<300 Hz) is limited, which is typical for lightweight absorbers without a mass layer.
As a result, Thinsulate performs very well in reducing:
road noise penetrating into the interior,
airborne noise,
and resonance of interior components within the range perceptible to the user.
PET non-wovens (fibrous alternatives)
Polyester (PET) non-wovens, often used as an alternative to Thinsulate, also operate mainly at mid and high frequencies, however:
their effectiveness depends heavily on thickness, compression and 3D shaping,
in the lower frequency ranges they usually require greater thickness to achieve a comparable effect,
they perform well in applications with more available space (e.g. floor systems, carpets).
In practice, PET is often chosen where:
integration with the component is important,
more installation space is available,
NVH requirements are not extreme in the lower frequency bands.
Engineering foams (PU, melamine)
Engineering foams constitute another group of alternatives:
they exhibit good absorption at mid and high frequencies,
in the case of melamine foams, effectiveness in the upper frequency range is very high,
efficiency at low frequencies remains limited without increasing thickness.
Their application is heavily dependent on:
environmental conditions,
flame retardancy and emission requirements,
the method of integration with the component.
Mass and damping layers (MLV, CLD)
Mass and vibration-damping materials are not direct substitutes for Thinsulate, but often complement the NVH package:
MLV (Mass Loaded Vinyl) operates mainly at low frequencies, blocking sound transmission at the cost of a significant increase in mass,
In practice, OEMs use these materials selectively, only where low-frequency reduction is critical.
3. Component mass and impact on vehicle balance
Mass reduction is one of the key requirements in OEM designs, particularly in e-mobility. Lightweight fibrous materials enable NVH requirements to be met whilst maintaining the component’s weight specifications.
In modern automotive designs, the weight of acoustic insulation components has a direct impact on vehicle weight balance, energy consumption and the fulfilment of design specifications, particularly in electric and hybrid vehicles. Materials such as 3M Thinsulate are designed as solutions offering high NVH performance with a relatively low mass per unit area, which is one of their key advantages in this field.
Typical Thinsulate variants used in the automotive sector range from approx. 200–600 g/m², depending on the required acoustic performance and thickness. By way of comparison:
PET non-wovens used in floor and carpet systems often have weights of 600–1200 g/m², particularly in 3D moulded configurations,
engineering foams (PU, melamine) offer good absorption, but in many applications require greater thickness, which translates into increased component weight,
mass layers (MLV) used as acoustic barriers have weights in the range of 2–5 kg/m², which significantly affects the vehicle’s overall balance and limits their use in modern platforms.
Thanks to its favourable NVH/mass ratio, Thinsulate enables the required acoustic and thermal parameters to be achieved without the need for heavy mass layers. In practice, this allows:
the mass of a single component to be reduced,
the design specifications of the entire vehicle to be maintained,
the need for mass compensation in other areas of the structure to be reduced.
From the perspective of OEMs and Tier 1 suppliers, this means greater design flexibility and the ability to optimise the NVH package without negatively impacting the vehicle’s mass balance. In many applications, it is precisely the low mass of Thinsulate-type materials that determines their selection over alternative solutions with similar acoustic performance.
4. Nominal thickness and behaviour under load
In Tier 1 and Tier 2 projects, it is essential to take into account the actual thickness of the material after installation, its compression, and its long-term dimensional stability over the vehicle’s lifecycle.
In automotive projects, the nominal thickness of acoustic insulation material is not a sufficient parameter for its correct selection. Equally important – and often more so – is the material’s behaviour after installation, i.e. its compression, thickness recovery and dimensional stability over time.
Materials such as 3M Thinsulate are available in several variants differing in grammage, thickness and structural stiffness, which directly affects their behaviour under load:
Low-grammage variantsThese are characterised by a lower nominal thickness and high susceptibility to compression. They are used where installation space is very limited and the material is not subjected to strong pressure from structural components. They are mainly suitable as a supplementary NVH layer or thermal insulation in low-pressure zones.
Medium-weight variantsMost commonly chosen in OEM projects as a compromise between acoustic performance, post-installation thickness and stability under load. The material retains good sound absorption even after partial compression, making it a versatile solution for doors, interior components and panels.
High-grammage variantsDesigned for applications with high NVH requirements, where the material is subjected to greater pressure or must maintain effectiveness in confined spaces. The higher mass and fibrous structure result in less loss of acoustic performance after installation, at the cost of greater nominal thickness.
From a design perspective, it is crucial to consider the actual thickness after installation, rather than just the catalogue value. A material that meets the requirements in its free state may lose some of its effectiveness after installation if it has not been selected for the appropriate load conditions.
5. Environmental resistance throughout the component’s lifecycle
In automotive projects, insulation and acoustic materials must retain their properties not only under laboratory conditions, but above all in the actual operating environment of the vehicle. Materials such as Thinsulate are designed for stable performance across a wide range of environmental conditions, making them a safe choice for OEM applications.
A key feature is moisture resistance – the fibrous structure does not absorb water and does not lose its acoustic or thermal properties under conditions of high humidity or periodic condensation. This is particularly important in applications such as doors, wheel arches, the boot or the vehicle floor.
The material’s thermal stability is also significant. Thinsulate retains its insulating and mechanical properties across a wide temperature range, allowing it to be used both in interior zones and in areas exposed to elevated temperatures. As a result, the material does not deform, crumble or lose thickness during long-term use.
6. Processability and integration into the production process
In automotive projects, the material’s compatibility with mass production processes, such as contour cutting, lamination and forming, is crucial.
7. Edge sealing as a process requirement
In many OEM and Tier 1 projects, edge sealing of fibrous materials is a process requirement, ensuring the component’s geometric stability, eliminating fraying and ensuring consistent quality in mass production.
8. Prototyping and validation prior to SOP
Projects in the sound insulation segment require the ability to produce samples and prototype components for NVH validation, assembly testing and preparation of documentation prior to SOP.
9. Material alternatives and cost optimisation
Materials such as Thinsulate are often the benchmark in insulation and acoustic projects, but in practice they are not always the only or necessary solution. Depending on the application, NVH requirements, thermal conditions and cost constraints, it is possible to use alternative technologies that meet OEM requirements and provide a comparable performance.
The most commonly used alternatives include polyester (PET) non-wovens, including 3D mouldable materials, which are widely used in flooring systems, carpets and interior components. They offer good sound absorption, dimensional stability and a favourable mass and environmental profile, particularly in high-volume projects.
In selected applications, engineering foams (e.g. melamine or polyurethane) are also used, which provide high acoustic performance in specific frequency ranges and good thermal insulation. Their use, however, is heavily dependent on environmental conditions, flammability requirements and the method of integration with the component.
NVH packages may also be supplemented by mass or vibration-damping layers (e.g. CLD, MLV), which do not replace fibrous materials but perform a different function within the insulation system – they reduce vibrations or block sound transmission in specific areas.
10. Compliance with OEM standards and flammability requirements
In projects carried out for OEMs and Tier 1 and Tier 2 suppliers, compliance of sound-deadening materials with standards is a prerequisite, regardless of their acoustic or thermal performance. Materials such as Thinsulate and their alternatives must meet both industry standards and vehicle manufacturers’ internal specifications, covering aspects such as flammability, emissions, durability and the reproducibility of parameters in mass production.
Flammability standards, such as FMVSS 302 / ISO 3795, which apply to vehicle interior components, are of key importance, as are requirements regarding odour and emissions of volatile organic compounds (e.g. VDA 270, VDA 278, ISO 12219). Equally important is the stability of material properties throughout the component’s life cycle, verified through environmental and ageing tests in accordance with OEM requirements.
Summary
In OEM, Tier 1 and Tier 2 projects, the selection of sound-deadening materials is a critical element of the APQP process. The right material decisions at the R&D stage help to mitigate quality risks, shorten implementation times and ensure NVH stability throughout the vehicle’s life cycle.
10 Ways to Reduce the Cost of Self-Adhesive Materials in B2B
January is a time when budgets start to feel the pinch in many companies. Targets and purchasing plans return, and very often — information about price increases from suppliers.
Regardless of whether material consumption is increasing or remaining at the same level, the costs of adhesive materials can suddenly spiral out of control.
At CVGS, we take a different approach. On the one hand, we actively minimise costs for our customers by analysing specifications, eliminating over-engineering, and optimising conversion, logistics and application. On the other hand, our scale of operation and optimised production mean that we are often cheaper than our competitors and, equally importantly, more predictable in terms of pricing in the long term. For customers, this means fewer surprises, more stable planning and greater control over their budget.
If your budget is no longer balanced because you have just received a pay rise, you have exceeded your cost assumptions, or you can see that this category is “running away” faster than planned, this article is for you.
We will show you where real savings can most often be found and how to implement them in practice. And if you want to go through the topic specifically, using your own data, schedule a free consultation and let’s check it out together. (click and schedule a consultation)
1) Reduction of overengineering (material that is “too good” for the need)
One of the most common reasons for high costs is overengineering, i.e. choosing materials with parameters significantly higher than required. In practice, you pay for properties that do not work in the application: too strong adhesive, too high chemical resistance, temperature, UV, etc. The solution is to adjust the specifications to the real conditions – without losing functionality.
Important: Reducing overengineering very often results in 10-30% savings on the material itself, without affecting the quality and safety of the process.
The first quick lever is to organise purchases: what we buy, from whom, in what quantities and on what terms. Savings often result from eliminating sub-optimal volumes, reducing the number of suppliers and improving commercial terms.
Important: A purchasing audit alone can reveal 5-15% of “hidden” costs that do not result from the unit price of the material.
3) Evaluation of technical specifications vs. actual application
The next step is to “link” purchases with technology: adhesion strength, resistance to temperature, moisture, UV – and the question: are these parameters really necessary in the customer’s process? This is where overengineering most often comes to light.
4) Verification of practical use (application and storage)
Even the best material will be “expensive” if it is poorly applied or poorly stored. We analyse application errors, storage conditions, process repeatability and areas where consumption can be reduced or work simplified – often without changing the material, and sometimes using a cheaper substitute.
Important: Improving application and reducing waste can lower the TCO of a category by another 5–10%.
5) Market comparison and material alternatives
The market is vast, and price differences between manufacturers can be significant while maintaining comparable quality. By analysing the available solutions, we identify cheaper or more effective alternatives (sometimes all it takes is a change of supplier or material technology).
6) Standardisation and unification (fewer variants = lower costs)
Many companies experience “variant inflation”: similar tapes/films/foams differ in detail. This increases the cost of purchasing, storage and logistics. Consolidating the product range and orders simplifies processes and strengthens the negotiating position, which translates into better prices.
Important: Standardisation can reduce the cost of an entire category by as much as 10–25% thanks to higher volumes, simpler logistics and a better negotiating position.
7) Optimisation of logistics and inventory management
Savings are not only about the price per roll/sheet, but also the “ancillary” costs: storage, handling, risk of expiry (e.g. adhesives) or damage. We optimise schedules and ordering methods to reduce tied-up capital and inventory losses.
8) Data- and scale-based negotiations with suppliers
Thanks to our knowledge of the market and relationships with manufacturers, we can negotiate better terms: discounts, more flexible delivery dates, more favourable framework agreements and payment terms – all of which directly improve profitability.
9) Selection of more economical converting technology
The high cost of self-adhesive materials is very often due not to the price of the raw material, but to a sub-optimally designed conversion process. Overly complicated die-cutting, excessive material losses or inefficient application methods can significantly increase the unit cost – even with good material.
That is why we analyse the entire process comprehensively — from the material selection stage, through the appropriate manufacturing technology, to the packaging and delivery of components to the customer’s production facility. The aim is to reduce waste, shorten operation times and simplify work on the end user’s side.
Examples of optimisation:
Selection of the right format (roll/sheet/loose) — so that the material reaches production in the form best suited to the application method, without unnecessary preparatory operations.
Matching cutting and punching technologies (e.g. rotary instead of flat) — simpler process, less waste and greater repeatability for large volumes.
Gap Tech technology — precise placement of elements with minimal spacing, which significantly reduces material waste and lowers the unit cost.
Kiss-cut solutions — easier and faster application, especially for manual or semi-automatic work.
Optimisation of packaging and delivery — smaller volume, easier handling in production and shorter preparation time for application.
10) Reducing application costs at the customer’s site (pull tabs/finger lifts, automation)
In B2B, the greatest savings are often on the “process side”, not the material side. The use of application-facilitating solutions (pull tabs/finger lifts) shortens application time, reduces errors and increases line efficiency, which has a positive impact on the work cycle time.
In addition, designing solutions for application machines reduces labour and improves repeatability.
Let’s assume:
time savings per application: 4–15 seconds,
annual volume: 100,000 units,
minimum national hourly rate in Poland in 2026: PLN 31.40 gross per hour.
Conversion of time savings into hours:
4 s × 100,000 = 400,000 s ≈ 111 hours
15 s × 100,000 = 1,500,000 s ≈ 417 hours
Conversion to labour costs:
111 h × PLN 31.40 ≈ PLN 3,485
417 h × PLN 31.40 ≈ PLN 13,104
This means that the use of pull tabs alone can generate savings of between approximately PLN 3,500 and over PLN 13,000 per year in a single application point — without changing the base material or interfering with the production process.
BONUS
BONUS
11) Free consultation with a technical and sales advisor (budget consolidation and work efficiency improvement)
If you have received a signal about price increases or you see that the costs of adhesive materials are starting to exceed your budget, the quickest way to verify the situation is during a short consultation. During the conversation, the technical and sales advisor will help you identify the simplest ways to save money: from adjusting specifications (reducing overengineering) to standardisation and material alternatives, to improving application and logistics.
Savings in adhesive materials rarely result from a single move. The greatest effect is achieved through a systematic approach: adjusting specifications to real requirements, reducing the number of variants, optimising conversion and logistics, and streamlining applications. The result is lower total cost of ownership (TCO), less waste, more stable deliveries and more predictable production.
Foam Expo 2024 in Stuttgart
We are thrilled to share that we participated in this year’s Foam Expo 2024, held in Stuttgart. It was an exceptional event that allowed us to strengthen our relationships with existing suppliers and establish new connections.
We brought back not only innovative materials but also fresh ideas for new product applications. One of the main goals of our visit was to explore the latest trends and innovations in the industry – and we achieved it successfully!
Thank you to everyone who visited our booth or met with us during the event. As always, we look forward to seeing you next year!