




LSE vs HSE
“It’s not that the tape doesn’t stick well — it’s that the surface won’t let it stick.”
Tomasz Gorzawski, CVGS
If you’ve ever tried sticking double-sided tape to a polypropylene casing and found that after a few hours it came off at the slightest touch — you weren’t just unlucky. You were dealing with a material with low surface energy. Understanding what surface energy is and how it classifies materials into LSE and HSE is the first step towards ensuring that adhesive bonds are no longer a matter of chance.
Surface energy in a single diagram
The quickest way to see the difference between LSE and HSE is to take a look at how the same tape behaves on both types of surface. The same adhesive. The same pressure. Different substrates. Different results.
The key factor is not the thickness of the adhesive layer, but rather how much of the substrate’s micro-profile the adhesive is able to fill. This is the whole difference between a bond that lasts for years and one that fails after a few hours.
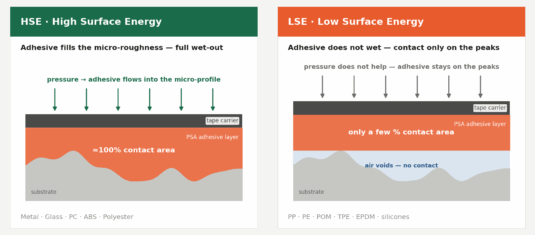
Fig. 1. The same tape on an HSE and an LSE surface. On the HSE, the adhesive fills the micro-roughness and achieves almost full contact with the substrate. On the LSE, it rests on the peaks of the profile — air gaps remain between the adhesive and the substrate, and the actual contact area is only a few per cent of the nominal area.
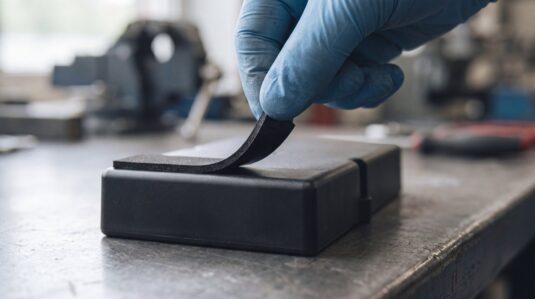
Fig. 1. This is how it looks in practice: the foam tape peels away from the PP casing almost without a trace — the adhesive never bonded to the substrate. (Illustrative photograph.)
CONDITIONS FOR GOOD BONDING
High surface energy of the substrate + good adhesive adhesion + adequate cohesion of the adhesive layer or carrier. If any one of these elements is missing, it is only a matter of time before the bond fails.
What are LSE and HSE?
Materials are divided into two groups based on their surface energy. The dividing line is conventionally set at 36–38 dyn/cm — above this value, most PSA adhesives bond well without additional treatment; below it, activation or a special tape for LSE is required.
We treat this value as a practical guide rather than a physical constant. The result depends on the specific material, the coating used, cleanliness, surface treatment and surface condition — which is why we have marked a zone on the graph rather than a single line.
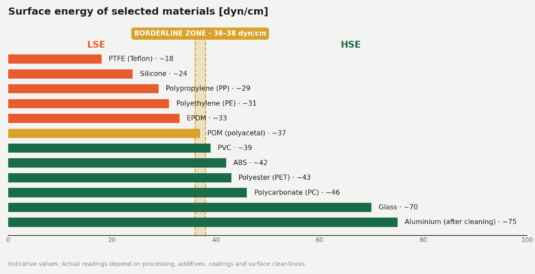
Fig. 2. A simplified scale of surface energy for typical manufacturing materials. The 36–38 dyn/cm range is a threshold area — below this, the material behaves like an LSE and requires activation or a special tape. The values are approximate; actual measurements depend on processing, additives and surface condition.
HSE — High Surface Energy
The adhesive wets the surface extremely well; adhesion is strong, and acrylic tapes (such as VHB) achieve full strength without additional activators. This group includes metals, glass, polycarbonate (PC), ABS, polyester, PVC, polyurethane, acrylics and Kapton.
LSE — Low Surface Energy
The adhesive does not spread; it forms droplets on the surface, and adhesion is poor or non-existent. Typical examples include: polypropylene (PP), polyethylene (PE — HDPE, LDPE), polyacetal (POM), thermoplastic elastomers (TPE, TPU), EPDM and modified PA6.
The most challenging materials are Teflon (PTFE) and silicones. To be more precise than simply calling them ‘non-bondable’: they are very difficult to bond using standard adhesive systems; however, with the use of dedicated primers, surface activation or special adhesives, a bond can be achieved.
Which materials are LSE and which are HSE — reference guide
Table 1 — Which materials are LSE and which are HSE: a cheat sheet
| Material | Surface energy [dyn/cm] | Group | What it means in practice |
|---|---|---|---|
| PTFE (Teflon) | ~18 | LSE | Requires dedicated systems, primers or activation |
| Silicones | ~24 | LSE | Standard PSAs do not bond; silicone adhesives needed |
| Polypropylene (PP) | ~29 | LSE | LSE tape or activation (flame, plasma, corona) |
| Polyethylene (PE — HDPE, LDPE) | ~31 | LSE | As above; a frequent issue with housings and flaps |
| EPDM, TPE, TPU | ~30–34 | LSE | Plasticiser migration on top — check compatibility |
| POM (polyacetal) | ~36–38 | borderline | Behaves differently from batch to batch — always measure |
| Modified PA6 | ~36–42 | borderline | Modifiers can push the material towards LSE |
| PVC | ~39 | HSE | Standard adhesives bond; watch out for plasticisers |
| ABS | ~42 | HSE | Good substrate for acrylic tapes |
| Polyester (PET), Kapton | ~43 | HSE | Stable, predictable bonds |
| Polycarbonate (PC), acrylics, PUR | ~44–46 | HSE | VHB reaches full strength without an activator |
| Glass | ~70 | HSE | Very good substrate after degreasing |
| Metals (steel, aluminium) | ≥75 after cleaning | HSE | Surface condition decides: oil, oxides, coatings |
Tab. 1. Indicative surface energy values and their consequences for tape selection. Materials in the borderline zone should always be measured before a solution is chosen.
Problem category — recycled materials and porous surfaces
Even if the base material is HSE, the presence of additives, stabilisers, mould release agents or a light coating of oil can drastically reduce the effective surface energy. The same applies to recycled surfaces — they may behave like LSE, even if they are chemically HSE.
In recycled materials and polymer blends, the variation in results is often significantly greater than for virgin materials. This means that a single measurement on a single batch is not sufficient to settle the matter.
FROM CVGS’S EXPERIENCE
We encountered a case where a tape with stable, repeatedly verified parameters ceased to function after the customer switched to recycled material. The cause was not the tape itself, but the unstable and reduced surface energy of the new substrate.

Fig. 2. Three batches of the same recycled component — differences in shade and texture are visible to the naked eye, and the surface energy varies accordingly. (Illustrative photograph.)
How to measure surface energy in practice — a marker or ink?
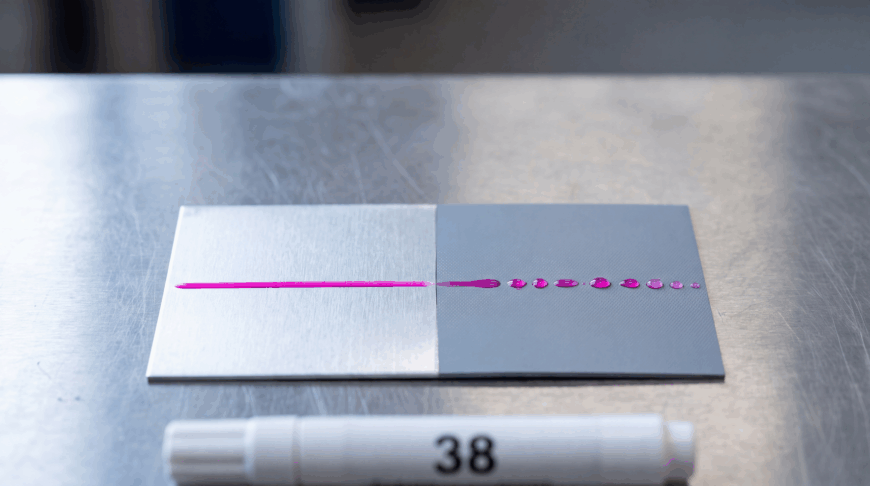
Before you choose a tape, it’s worth knowing exactly what you’re working with. Two tools calibrated to a specific value in dyn/cm (usually 38) are used for this: a test marker and test ink. The reading principle is the same in both cases — you draw a line several centimetres long and observe it for 2–4 seconds (the observation period depends on the type of ink). A line that remains straight indicates that the surface has at least the tested energy level. A line that converges into dots or ‘shrinks’ indicates a lower energy level.
The difference between the marker and the ink therefore does not lie in the physics of the measurement, but in what happens to the tool after it comes into contact with a dirty surface.
How to interpret the result — three scenarios you’ll see on site
In practice, the line behaves in one of three ways, each leading to a different decision:
- The line retains its shape for over 2 seconds — the surface has at least the tested energy level. You can bond using a standard solution.
- The line breaks up into dots in less than a second — a classic LSE. You’ll need LSE-grade tape or surface activation.
- The line breaks in places — part of the line holds, part shrinks. This is usually not down to the material, but localised contamination: oil, a fingerprint, or a release agent from the mould. Clean, degrease and measure again.
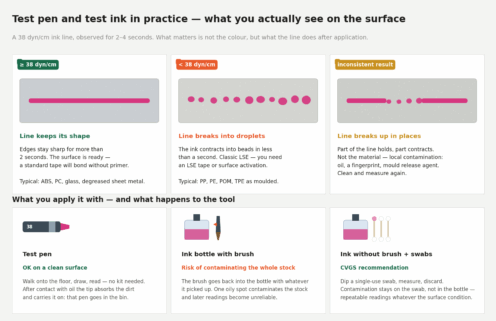
Fig. 3. Three typical readings for a 38 dyn/cm line and three ways of drawing it. The marker and the ink measure the same value, but they cope differently with contact with a dirty surface — and it is this difference, rather than accuracy, that determines the choice of tool.
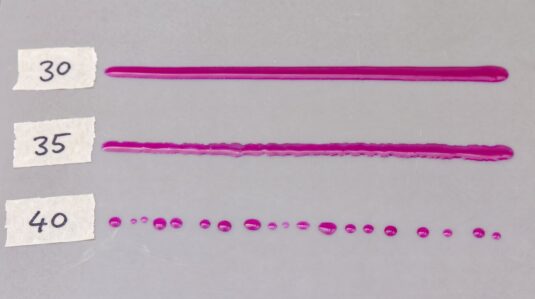
Fig. 3. Bracketing on a PP panel: ink 30 wets the surface and holds the line; 35 begins to break up at the edges; 40 shrinks into droplets — the surface energy of the material is approx. 30–35 dyn/cm. (Illustrative photograph.)
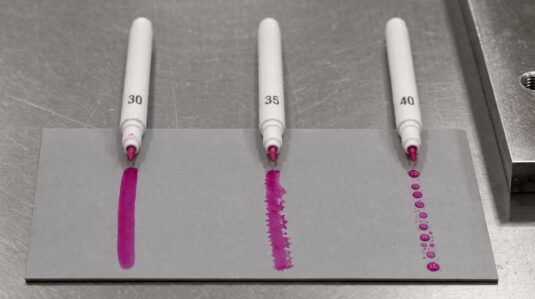
Fig. 4. The same measurement using 30/35/40 test pens — three marks, three behaviours, one answer. (Illustrative photograph.)
Five scenarios from the production floor
Theory ends the moment you stand at the machine. Below are the scenarios that occur most frequently in surface energy testing — and the conclusions that can be drawn from them.
- A PP housing straight from the injection moulding machine. The line breaks up immediately. No surprise there – PP is LSE by definition. The decision is made straight away: LSE tape or activation.
- Aluminium sheet after stamping. The marker reads ‘below 38’, even though aluminium is a textbook HSE material. You’re not measuring the metal — you’re measuring the thin layer of process oil left on it. After wiping with IPA, the mark holds. This is the most common cause of ‘strange’ results on metals.
- Polycarbonate with protective film. The line holds beautifully – except that it’s on the film, not on the material itself. The test is always carried out on the surface that will actually come into contact with the tape, not on whatever happens to be on top.
- PP after flame activation. Immediately after activation, the 38-line mark holds. After two days, the effect is already noticeably weaker — the activation wears off over time. It is therefore necessary to measure not only immediately after activation, but also at the end of the actual window between activation and bonding.
- A detail from recycled material, another batch of raw material. The previous batch passed the test without any issues; the same line on the new batch breaks up into dots. With recycled materials, measurements are taken batch by batch, rather than just once per production run.

Fig. 5. Flame activation of a PP profile on the production line — increases the surface energy of polyolefins from approx. 30 to over 45 dyn/cm, but the effect diminishes over time. (Illustrative image.)
Test marker — quick verification at the customer’s premises
The marker is unrivalled where time is of the essence: you walk into the workshop, draw a line, and you have your answer. It requires nothing but itself. However, it has one condition for use and one pitfall.
- Clean surface — reliable result. The marker works perfectly on substrates prepared for bonding: after washing, degreasing and activation.
- A dirty or oily surface — throw the marker away. The tip absorbs dirt from the surface and carries it over to subsequent measurements. The effect is insidious: once the marker comes into contact with oil, it starts to ‘underestimate’ the results even on sound materials, so the technician rejects batches where nothing was actually wrong.
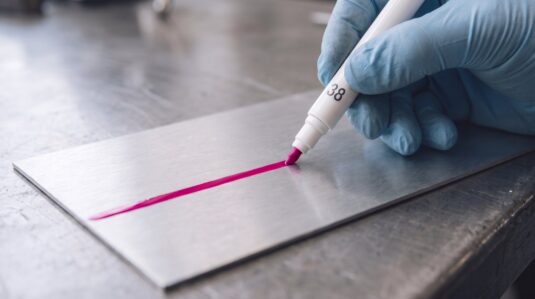
Fig. 6. A 38 dyn/cm marker on degreased aluminium — the line retains its shape, and the surface is ready for bonding. (Illustrative photograph.)

Fig. 7. The same value on polypropylene — the line shrinks into droplets in 2–4 seconds. A classic LSE reading. (Illustrative photograph.)
LSE. (Illustrative photograph.)
Test ink — repeatable measurement in the production process
Ink in a container with a brush has a design flaw that only becomes apparent in the actual production process: the brush returns to the container along with whatever it has picked up from the surface. A single oily substrate is enough to contaminate the entire stock.
CASE STUDY
The client was using ink in a container with a brush to inspect surfaces prior to the bonding process. The measurement showed a decrease in surface energy, and analysis indicated partial oil contamination of the material. The problem was that oil had also entered the ink container — from that point onwards, the entire measurement system was contaminated, and subsequent readings were no longer reliable.
CVGS recommendation: ink without a brush + disposable application swabs. After each contaminated measurement, you discard the swab, not the entire set.

Fig. 8. The brush returns to the bottle with what it has picked up from the surface — a rainbow-coloured oily film is already visible on the surface of the ink. From this point onwards, the entire supply is contaminated. (Illustrative photograph.)

Fig. 9. Recommended kit: 10 ml ink without a brush and disposable swabs — a new swab for each measurement. (Illustrative image.)
When to use a marker, and when to use ink
Table 2 — When to use a test pen and when to use test ink
| Situation | Recommended method | Why |
|---|---|---|
| Quick check at the customer’s site, clean surface | Test pen | Result in 2–4 seconds, no kit, nothing to spill |
| Check after washing or degreasing | Test pen or ink with brush | A prepared substrate does not contaminate the tool |
| Surface of unknown condition, suspected oil contamination | Ink without brush + single-use swabs | Contamination stays on the swab, not in the ink stock |
| Routine in-line inspection | Ink without brush + single-use swabs | Repeatable readings over time and across shifts |
| Verifying activation effectiveness (flame, plasma, corona) | Set of inks at several dyn/cm values | Gives the actual level, not just “above / below” |
| Recycled materials, variable raw-material batches | Ink without brush, measured batch by batch | Batch-to-batch scatter is larger than for virgin polymers |
Tab. 2. Choosing a surface energy inspection method depending on the production situation.
Why this matters in production
The difference between LSE and HSE is not merely academic. In practice, it works as follows:
A polycarbonate (HSE) component bonded with VHB tape achieves full strength and does not delaminate even under dynamic loads. The same tape on a polypropylene housing will delaminate ‘with a fingernail’ after a few hours if the surface has not been prepared beforehand.
That is why the first question to ask when designing an adhesive bond is: what material am I working with — LSE or HSE? The answer determines everything: the choice of tape, the need for surface preparation, and the need to use a primer or activation (flame, plasma, corona).
Tapes designed for LSE — how they work
Since LSE surfaces ‘do not like’ adhesive, tape manufacturers have developed solutions capable of winning them over. Tapes for LSE have several features that distinguish them from standard ones:
- High wet-out — adhesives with a very high ability to wet the surface.
- Greater adhesive elasticity — allowing micro-roughness to be filled in.
- Modified rubber or special LSE acrylics — as the chemical base.
- Higher tack — the adhesive ‘grips’ the difficult surface immediately.
- The ability to eliminate the need for a primer — in many applications, it is no longer necessary to use an activator.
Typical applications for LSE tapes
Assembly of PP and PE components (housings, flaps, handles). Bonding of foams to PP/PE. Labelling of LSE surfaces. Assembly of decorative elements onto plastics. Bonding of EPDM and TPE seals. Applications in the automotive and household appliances sectors. Logistics labels on LSE surfaces.
The water drop test — when you don’t have a marker or ink to hand
In production environments, it is not always clear what the actual surface energy of a material is — particularly after processes such as injection moulding, painting or embossing. We have discussed markers and ink above; if you do not have either to hand, there is a method that requires nothing more than water.
The contact angle is assessed. A drop that spreads out flat (small contact angle) indicates high surface energy. A drop that retains a hemispherical or ‘spherical’ shape (large contact angle) indicates low surface energy. The test does not provide a numerical value, but within a few seconds it shows the general trend and allows you to decide whether it is even worth using standard tape.
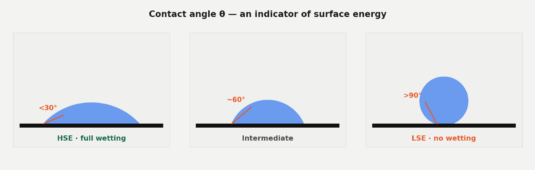
Fig. 4. Contact angle of a water droplet: below 30° — an HSE surface; above 90° — an LSE surface requiring activation.
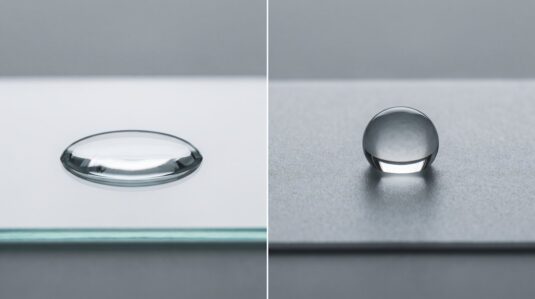
Fig. 10. The same drop of water on glass (HSE) and on polypropylene (LSE) — the difference is visible without any equipment. (Illustrative photograph.)
PRACTICAL TIP
All three tests — the marker, ink and water droplet tests — take 2–3 seconds and require no specialist laboratory equipment. These are the bare essentials that should form part of every bonding technician’s toolkit.
Summary
Surface energy is a key parameter that determines whether bonding will be successful — regardless of how good the tape we buy is. HSE materials (metals, PC, ABS, glass) adhere well to adhesive. LSE materials (PP, PE, POM, TPE, EPDM) require either special tapes or surface activation. Distinguishing between these two groups, measuring the actual condition of the surface — rather than guessing — and making an informed choice of solution are the foundations of any durable adhesive bond.
“The quality of the bond is determined before you apply the adhesive — on the surface.”
Tomasz Gorzawski, CVGS
Previously, we showed you the difference between cohesion and adhesion; today, we’ll look at how LSE and HSE materials differ. In the next articles in this series, we’ll show you how to effectively prepare a surface for bonding, how to choose the right type of adhesive (acrylic vs rubber vs silicone), and how to measure bond quality using the Peel, Loop Tack and Rolling Ball methods.
Download the catalogue
Do you want to get more information about our company, products or services? Just provide your e-mail address and we will send the cvgs company catalog to it!
free consultation

